Market Reports
Just as I did last year, my Early Spring newsletter focuses on Montclair’s past year’s market performance at a granular level so I can help you plan your strategy for buying or selling in the coming year. I am sure you have read all about the regional real estate market, but this newsletter takes a micro view of the local Montclair market. Several of the takeaways you can apply to other towns but if you would like reports for other towns, don’t be afraid to reach out to me.
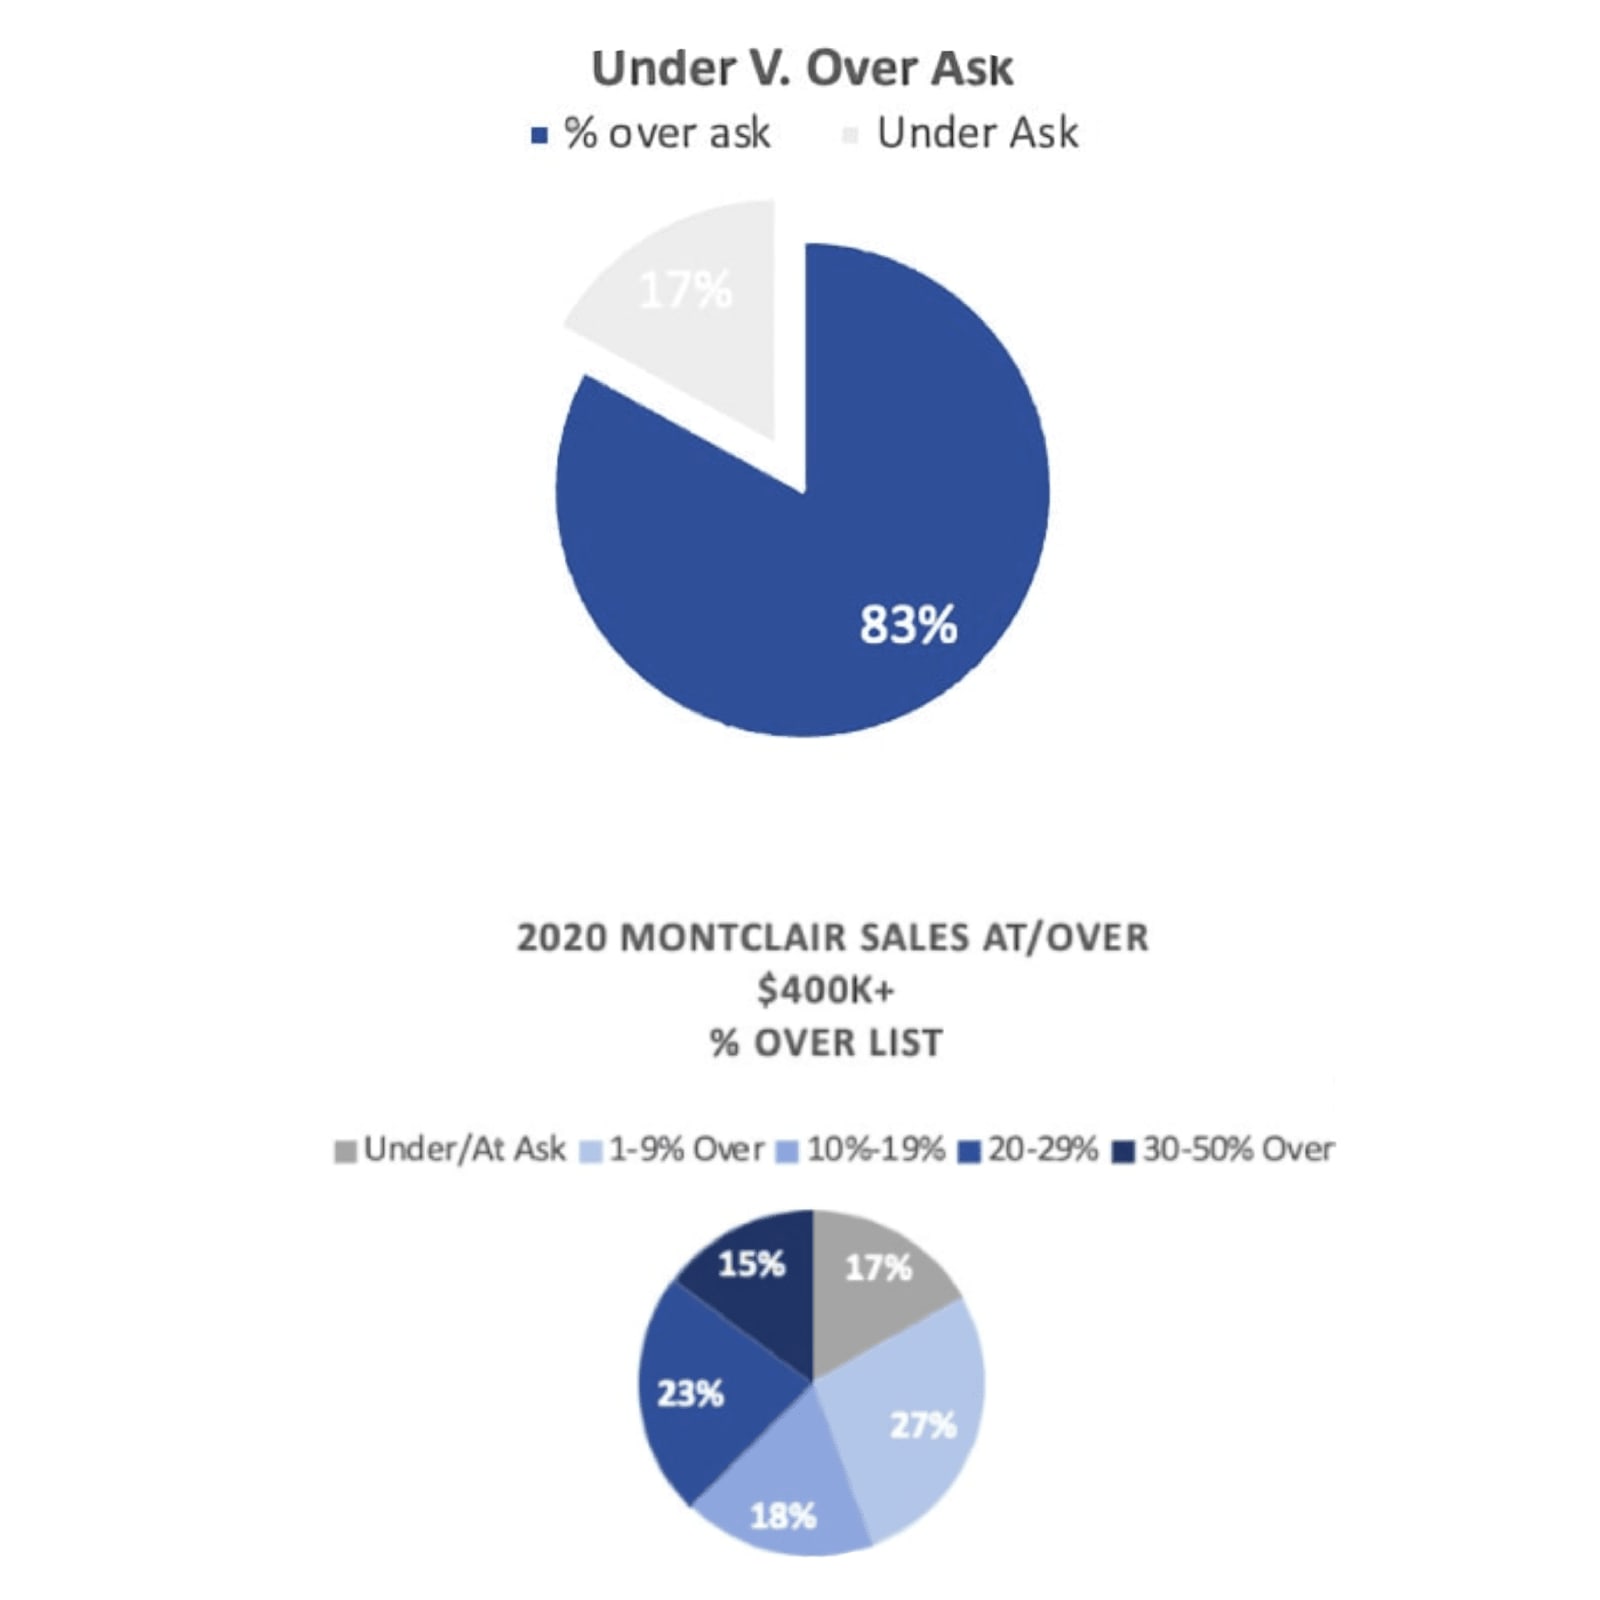
There were 370 single-family homes in Montclair NJ listed at or over $400k on the GSMLS that sold between January 15 last year to the same time this year, Of all the properties sold about 83% sold for over-ask* and 17% sold for at or under-ask.
The average sold price this year was significantly higher than last year at $1,004,767. Homes sold an average of 151,494 over-ask, twice what it was the year before. This year we had a slight uptick in inventory due to sellers taking advantage of a healthy buying market.
*****An important note about OVER-ASK versus OF-ASK. These are 2 different numbers entirely. Of ASK is the listed amount DIVIDED by the sale amount. Many homes in Montclair get 100% OF ASK (as you can see from the report) as the real estate community typically under-list properties to generate market attention. OVER ask is the DIFFERENCE between the list and sales. Over-ASK is a more sensitive barometer of the market and agent performance.

Given the data and the market conditions, we expect to continue to see a strong market seller’s market in 2021. Housing prices will continue to stay competitive (absent of any market corrections - as Wall Street likes to say) and sellers still have the upper hand as inventory remains low. That being said, for those willing to do renovations, or look beyond “ brand name towns” there are still opportunities to find value when purchasing a home. Looking further into the year, as the vaccine becomes more widespread, the weather warms and people feel freer to move about, there is hope that inventory will increase. Let’s review the major events that affected the market, many of which will continue to affect the market in 2021.
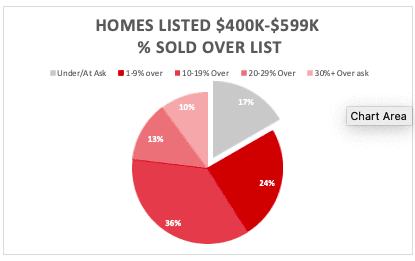
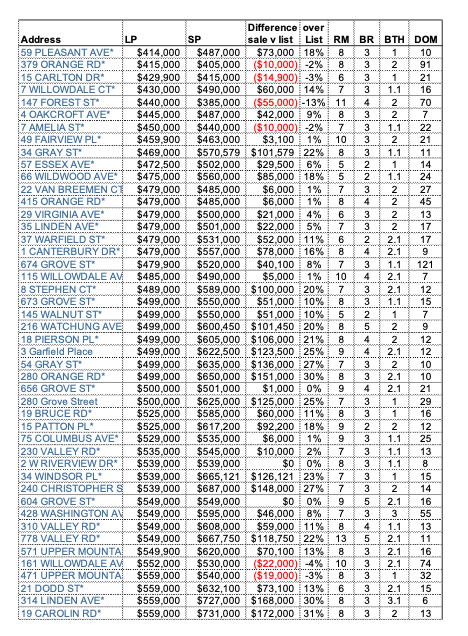
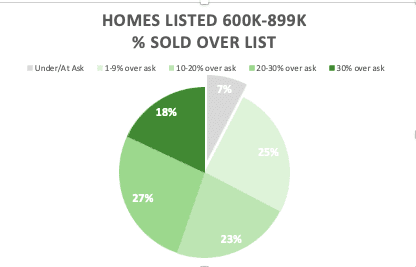
Homes in this price range are smaller (think 1BTH, 2-3 BR), great for starter homes or downsizers, and some are in need of substantial renovation or are underlisted to attract buyers (see my article regarding this). With rising prices, finding homes in this range has increasingly become increasingly rare. We had fewer homes listed in this range than last year. With a total of 78 homes available, the good news is for buyers is that 17% of homes listed up to $599k did stay at or below the list price. And if you have a vision, or do not mind a renovation, there were deals to be had.
• 83% of these properties sold for over-ask
• The average sale price was $603,625
• 60% of homes sold from 1%-20% ($3k-$42K) over-ask
• 24% sold from 1-9% over-ask and
• 36% of homes sold up to 20% over-ask (up to $100k)
• 10% went above 30% over ask ($168k-$240K)
• The average amount over-ask was just below $84,000
• The lowest sale from this group was $385K (list $440k)
• The highest sale was $870K (list $599k)
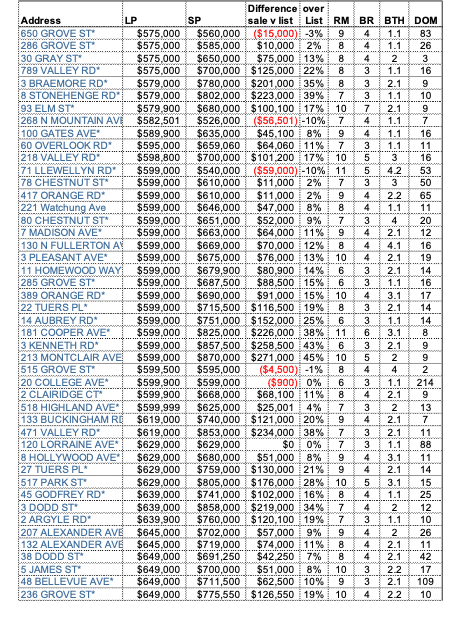
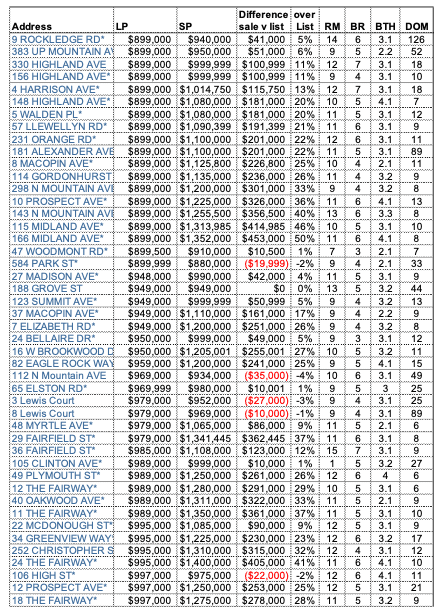
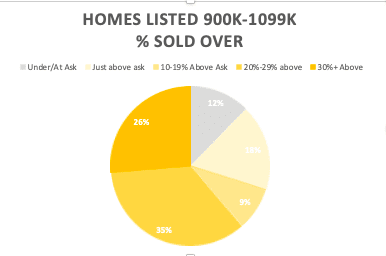
Typically, this range is the most popular price point, and this year was no different with 172 properties listed. However, it was how they performed on the market that made the most difference. Case in point.
92% of these properties selling over ask, and a mere 7% sold at or under ask, If you are a buyer, it’s rare to find a deal in this price range, The average difference between list and sale was priced $150,468 – this is double the amount than the previous year. Unlike years before, 18% (31) of these properties sold OVER 30% of asking (a third of that venturing into the 40-50% over ask, venturing into $1M-$1.3M price
The rest of the sales were evenly distributed from 10%-30% over ask. The average sale price surprisingly was not far over the top of the list price at $908,757.
$1.352M (asking $899K) was the highest sales price (I feel this is an example of under-listing a house – this was a well-located “estate” with 7BR and in need of work, but it was never going to sell for $899K).
$629K (asking $629K) was the lowest sales price.
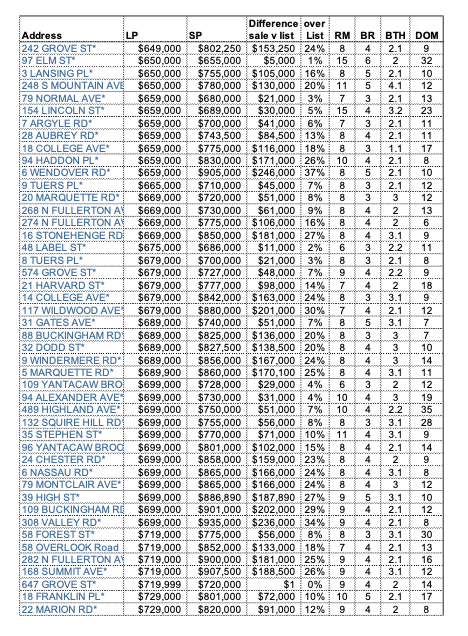
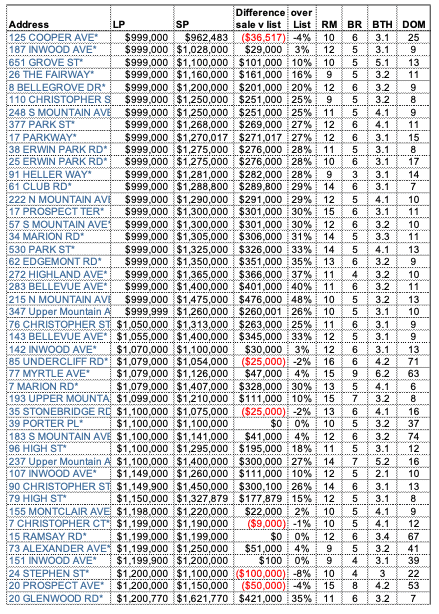
This is the unusual price range that straddles the upper end of the midrange market and into the low high-end market. These are homes that are larger (but not mansion size), with more rooms, property, and of course taxes. It’s a narrow price range but very sought after and only had a total of 57 properties for sale this year – that’s not a lot of inventory but demand for these homes is high because they check off a lot of boxes for buyers, lots of space but not too much that they are overwhelmed, usually a “forever-home”, often located in tight-knit neighborhoods. Of these:
Of these homes sold for over asking.
The average sale price.
Sold above 21% - 30%.
The average difference in list price versus sale price.
The lowest sale price in this range (asking $969k).
The highest price in this range (asking $999k).
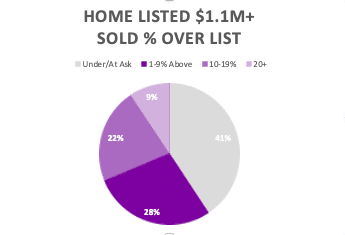
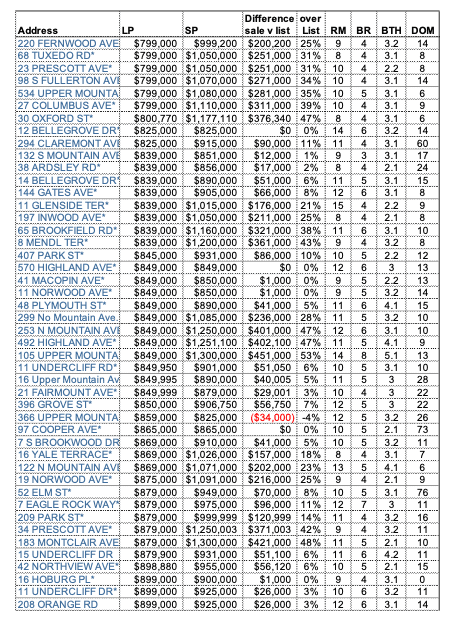
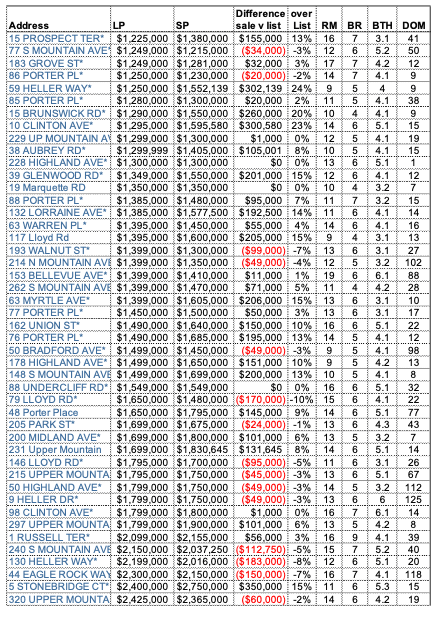
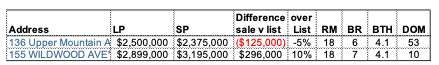
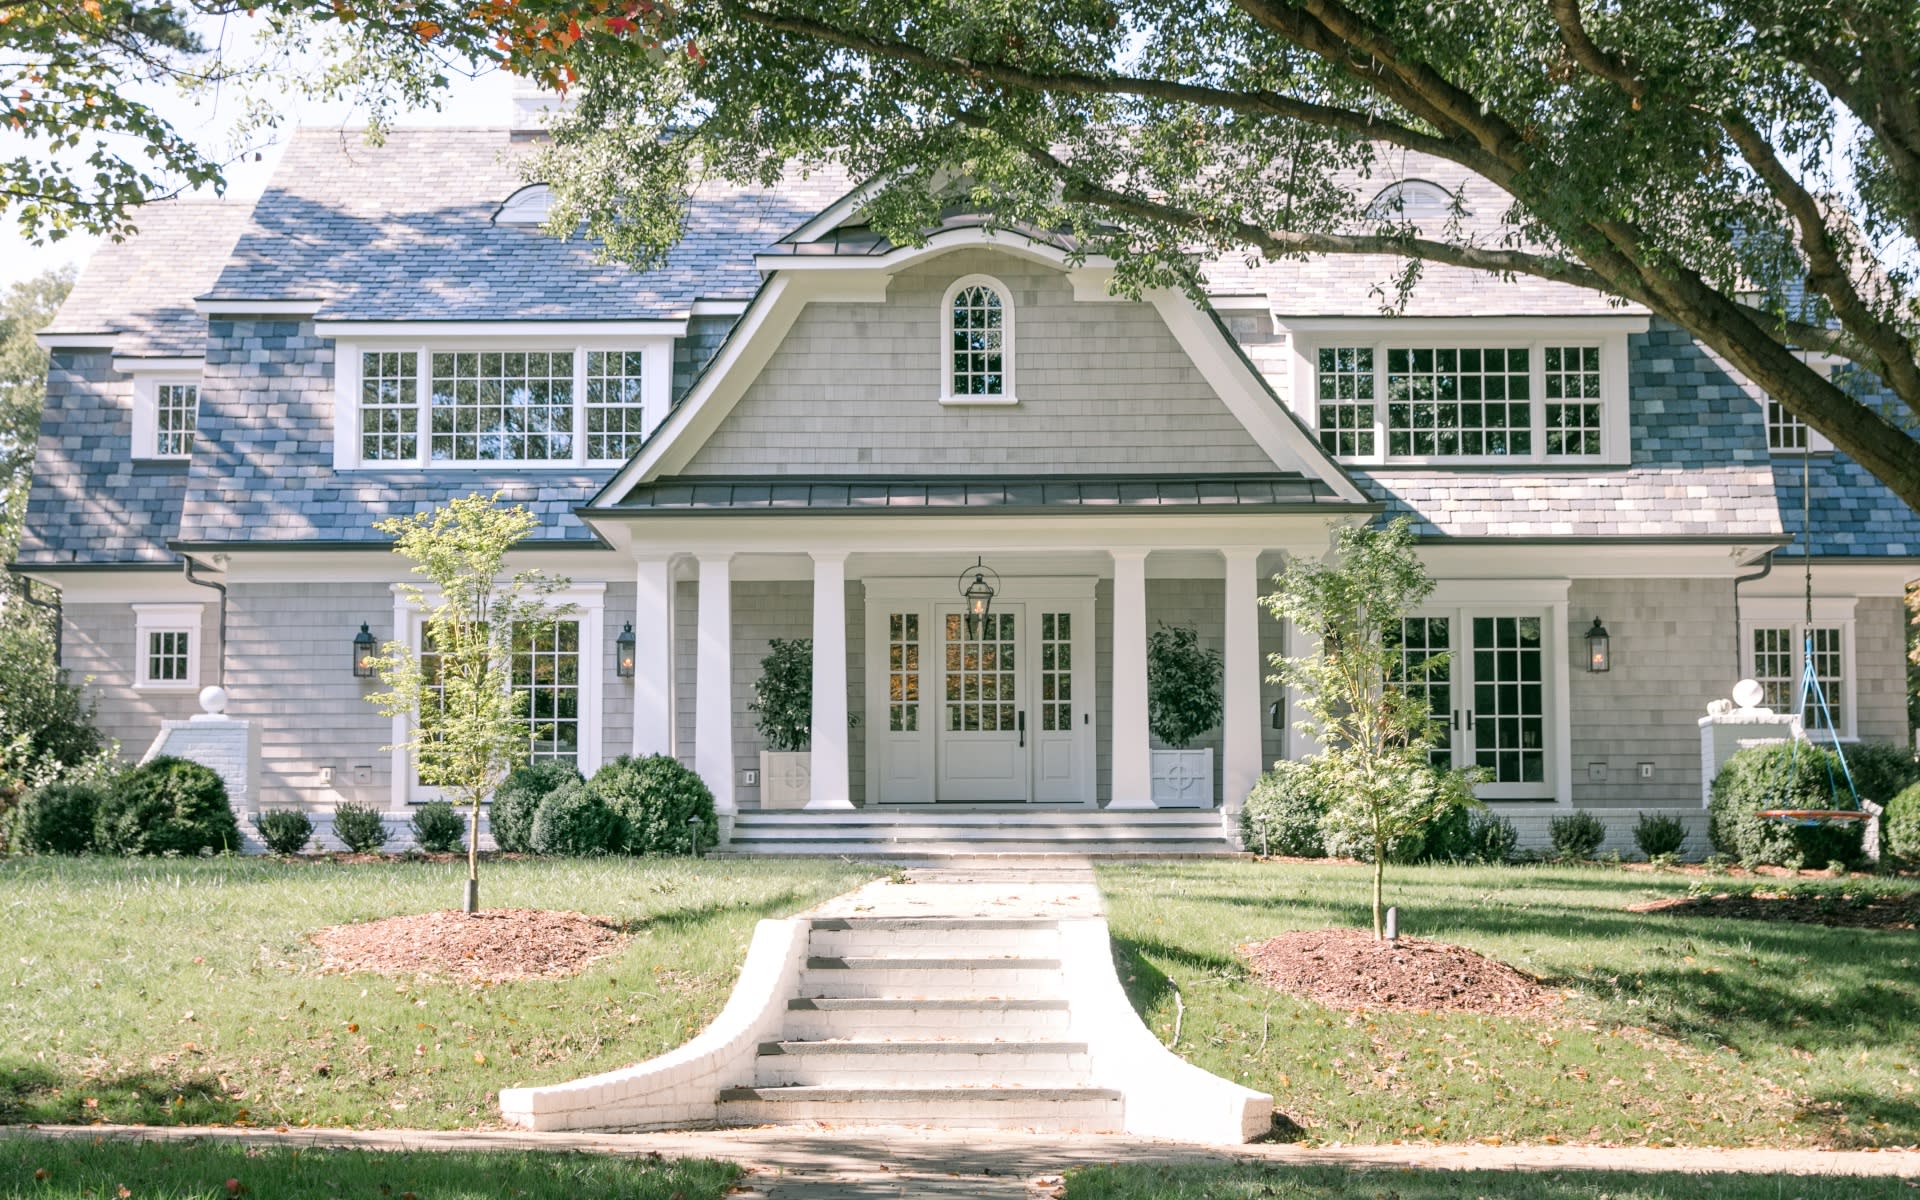
A class of its own, many of these homes are either estates or larger homes with full renovations. Interior square footage, property size and finishes dictate this market. These are custom, older and often very beautiful homes with irreplaceable craftsmanship, and lovely, landscaped properties. As we discussed before, this market houses in this market tend to move more slowly but even before Covid the luxury market has picked up in many towns. And its important to understand in other towns like Glen Ridge and Essex Fells, where these homes are commonplace, demand is always high due to great schools strict zoning and high demand. There were 64 homes that fell into this category, of these
The average sale price.
The lowest sales price (asking $1.1).
The highest (asking $2.899).
Sold for over-ask and 41% of these homes sold for at or under-list.
The average difference between list and sale.
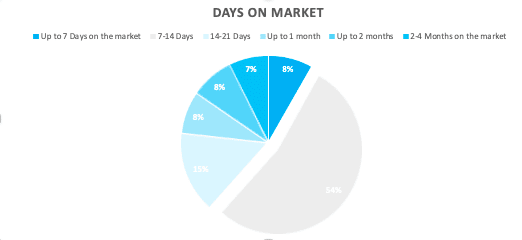
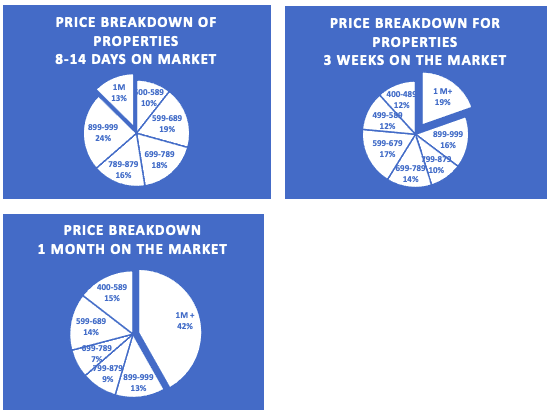
Days on Market gives you a good idea about how fast the market is moving and is a great indicator of pricing. For buyers, it’s important to note that most of the houses sell within the FIRST 10 days of going to market, this is the reason that 54% of home sales in Montclair happen within the first 2 weeks. You have only a single weekend in most cases to make an offer.